
Dashboard Overview
This topic provides a general overview of the ArchiTECH dashboard. It highlights the major elements and provides references to other topics for additional help.
Site Dashboard Overview
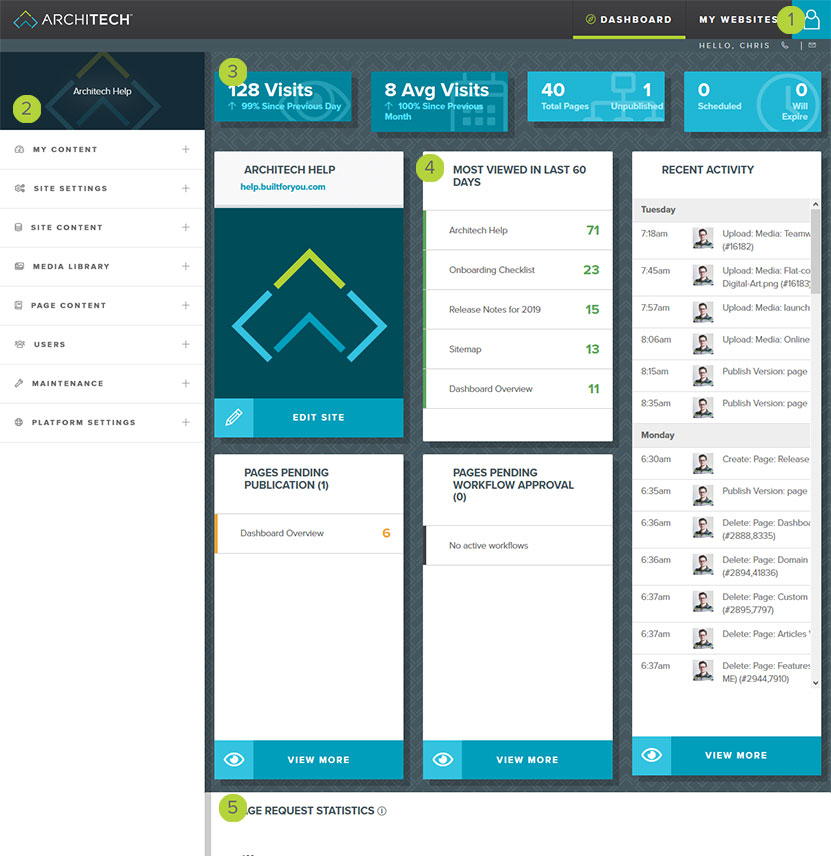
The ArchiTECH dashboard provides you with the management tools you will need to update and maintain your site. It is through the dashboard that you can organize content, media assets, permissions, and other elements not otherwise configurable directly on your web site. The health and activity of your site can also be monitored from the dashboard. In this topic, several areas of the dashboard are discussed with references to additional topics.
MY WEBSITE AND MY PROFILE MENU
If you manage multiple websites, you can use the My Websites menu to switch between dashboards to select the active site.
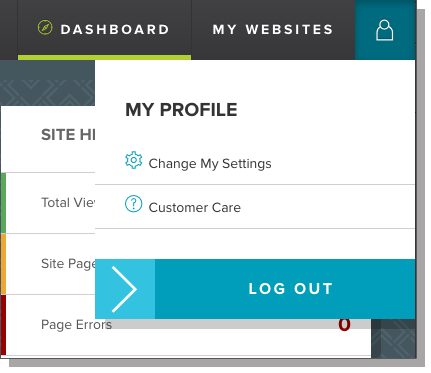
The My Profile menu allows you to modify your ArchiTECH account settings, seek help or log out. To open this menu, click the User icon in the upper right corner of the view.
Main Navigation Panel
The navigation tree provides easy access to each of the dashboard views used to manage your site. The views are grouped into the following top-level areas:
Dashboard - Shows your site name and presents this view
My Content - provides your bookmarked pages
Site Settings - Provides configuration options that affect the entire site
- Domain Settings
- Custom Page Types
- Page Add ons
- Analytics and Tracking configuration
- Workflow Configuration
Site Content - Views that provide content review and configuration
- Features / Amenities
- Forms
- Map Regions
- Albums
- Tags
- Workflow Execution History
- Site Calendar
Media Library - manage image, video, and document assets
- All Media
- Unused media
Page Content - Views that provide content review and configuration
- View all of the pages in your site
- View pages of certain content types that are specific to your site
Recycle Bin - View deleted items that can be restored or removed.
User Management - Modify who can access your site and their permissions
- Administration
- Custom Roles
- Permissions
Maintenance - Additional features to keep your site running smoothly
- Search Index
- Audit Logs
SITE STATISTICS AND OVERVIEW
Quick Stats Panels
The site overview and health panels provide general status details about your site.
You will see some basic information
- Daily page visits over the past 24 hours (and the trend from the previous day)
- Monthly Average page visits over the past 30 days (and the trend from the previous month)
- Total number of pages and the number of unpublished pages
- The number of pages auto-scheduled to publish or unpublish
Site Preview Pane
The site preview panel is a visual indicator for the site you are currently editing and is especially helpful when managing multiple sites. The name and primary domain for your site are displayed at the top, followed by your site placeholder image and a button that will enable site edit mode.
Dashboard Panels
Most Viewed Pages
This panel displays the top few pages that your visitors have viewed over the past 60 days. This is useful in determining what content your visitors are interested in seeing, and where to focus your digital marketing efforts.
Pages Pending Publication
The pending publication panel provides a summary of pages with edits that have yet to be published. This information is also available on the Pages view. Click on the entry to view the page with pending edits, or click the View More button to be taken to a filtered page view to see all pages on your site that have pending edits.
Workflow Approval
The workflows panel will show any page with an active workflow that requires your attention to approve or deny the pending page edits. Click on the entry to view the page, or click the View More button to visit the workflow execution history page to see all pages that require attention.
Recent Activity
The recent activity view shows all of the actions your site users have taken, as well as any automated scheduled tasks that will take place. This view shows all data for the current week, or you can click the View More button to view the Site Calendar page for a monthly view.
Page Request Statistics
The page graph shows the number of page visits to all pages on your site over time. You can use the small area beneath the larger chart area to zoom into a specific date range.
This data represents the number of times your pages were requested from the server from any source and may include page visitors, web-crawlers, or automated systems. If your site also uses external tracking, such as Google Analytics, the values may not match due to other systems filtering data or visitors using ad-blocking software.
LAST UPDATED: 6/25/2019